Using XHProf to Profile Your Drupal Module

Headshot of Tim Stallman with building backdrop

Tim Stallman —

Scroll Trigger Image

This is part 2 of a series on using XHProf for profiling Drupal modules.


After you’ve installed XHProf, what’s next? How can you make use of its recommendations to tune a module or a website? Unfortunately there are no hard-and-fast rules for optimizing code to run more efficiently. What I can offer here is my own experience trying to optimize a D8 module using XHProf.

RELATED READ

Installing XHProf to Profile Drupal Module

Understanding an XHProf run report

The XHProf GUI displays the result of a given profiler run, or a group of runs. It can even compare 2 runs, but we’ll get to that in a minute. If you followed my previous post, you should have the xhprof_html directory symlinked into the root web directory for your Drupal site; so visiting <my-local-site>/xhprof/ should give you a list of all available stored run IDs, and you can click through one of those to view a specific run report.

You can also go directly to a specific run report via the URL <my-local-site>/xhprof/index.php?run=<run-id>&source=<source-id> (which you should have been logging already via an echo statement or dblog if you followed the last post).

Header of an XHProf run report

The core of the run report is a table of each function or method which your code called while it was being profiled, along with a set of statistics about that function. This allows you to understand which parts of your code are most resource-intensive, and which are being called frequently in the use case that you’re profiling. Clicking on any one of the column headers will sort the list by that metric. To understand this report, it’s helpful to have some terminology:

  • Incl. Wall Time - The total clock time elapsed between when a function call started and when the function exited. Note that this number is not a great basis for comparisons, since it can include other processes which were taking up CPU time on your machine while the PHP code was running, from streaming music in the background to PHPStorm’s code indexing, to random web browsing.
  • Incl. CPU Time - In contrast to wall time, CPU time tracks only the time which the CPU actually spent executing your code (or related system calls). This is a more reliable metric for comparing different runs.
  • Excl. Wall/CPU Time - Exclusive time measurements only count time actually spent within the given method itself. They exclude the time spent in any method/function called from the given function (since that time will be tracked separately).

In general, the inclusive metrics (for CPU time and memory usage) will give you a sense of what your expensive methods/functions are – these are the methods or functions that you should avoid calling if possible. In contrast, the exclusive metrics will tell you where you can potentially improve the way a given method/function is implemented. For methods which belong to Drupal Core or other contrib modules, inclusive and exclusive metrics are basically equivalent, since you don’t usually have the option of impacting the implementation details of a function unless you’re working on its code directly. Note also that because your overall parent method and any other high-level methods in your code will always show up at the top of the inclusive time chart, you may have better luck really understanding where your performance hits come from by sorting by exclusive CPU time.

Take a step back and plan your test scenarios

Before digging in to optimizing your module code, you need to take a step back and think about the big picture. First, what are you optimizing for? Many optimizations involve a tradeoff between time and memory usage. Are you trying to reduce overall run-time at the expense of more memory? Is keeping the memory footprint of a given function down more important? In order to answer these questions you need to think about the overall context in which your code is running. In my case, I was optimizing a background import module which was run via cron, so the top priority was that the memory usage and number of database optimizations were low enough not to impact the user-facing site performance.

Second, what use case for your code are you profiling? If this is a single method call, what arguments will be passed? If you’re profiling page loads on a website, which pages are you profiling? In order to successfully track whether the changes you’re making are having an impact on the metrics you’re concerned about, you need to be able to narrow down the possible use cases for your code into a handful of most-likely real world scenarios which you’ll actually choose to track via the profiler.

Keep things organized

Now it’s time to get organized. Write a simple test script so that you can easily run through all your use cases in an automated way – this is not strictly necessary, but it will save you a lot of work and potential error as you move through the process. In my case, I was testing a drush command hook, so I just wrote a bash shell script which executed the command three times in each of two different ways. For profiling page loads, I would recommend using Apache JMeter - and you’ll need to consider whether you want to force an uncached page load by passing a random dummy query parameter. Ideally, you should be running each scenario a few times so that you can then average the results to account for any small variations in run-time.

Keeping your different runs organized is probably the most important part of successfully profiling module code using XHProf! Each run has a unique run ID, but you are solely responsible for knowing which use case scenario and which version of the codebase that run ID corresponds to. I set up a basic spreadsheet in OpenOffice where I could paste in run numbers and basic run stats to compare (but there’s almost certainly a nicer automated way to do this than what I used).

Header of an XHProf run report

Once you have a set of run IDs for a given use case + codebase version, you can generate a composite xhprof report using the query string syntax http://<your-local-site>/xhprof/index.php?run=<first-run-id>,<second-run-id>,<third-run-id>&source=<source-string> Averaging out across a few runs should give you more precise measurements for CPU time and memory usage, but beware that if parts of your code involve caching you may want to either throw out the first run’s results in each version of the code base, since that’s where the cache will be generated, or clear the cache between runs.

Go ahead and test your run scripts to make sure that you can get a consistent baseline result at this point – if you’re seeing large differences in average total CPU times or average memory usage across different runs of the same codebase, you likely won’t be able to compare run times across different versions of the code.

Actually getting to work!

After all this set-up, you should be ready to experiment and see what the impact of changes in your code base are on the metrics that you want to shift. In my case, the code I was working on used a streaming JSON parser class, and I noticed that one of the top function calls in the inital profiler report was the consumeChar method of the parser.

Image of XHProf profiler report with the method consumeChar highlighted in yellow

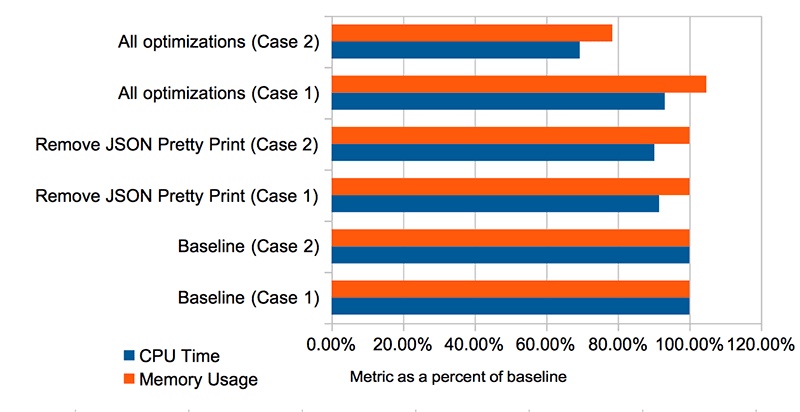
It turns out that the JSON files I was importing were pretty-printed, thus containing more whitespace than they needed to. Sine the consumeChar method gets called on each incoming character of the input stream, that added up to a lot of unnecessary method calls in the original code. By tweaking the JSON file export code to remove the pretty print flag, I cut down the number of times this method was called from 729,099 to 499,809, saving .2 seconds of run time right off the bat.

That was the major place where the XHProf profiler report gave me insights I would not have had otherwise. The rest of my optimizing experience was mostly testing out some of the common-sense optimizations I had already thought of while looking at the code – caching a table of known Entity IDs rather than querying the DB to check if an entity existed each time, using an associative array and is_empty() to replace in_array() calls, cutting down on unnecessary $entity->save() operations where possible.

It’s useful to mention that across the board the biggest performance hit in your Drupal code will probably be database calls, so cutting down on those wherever possible will save run-time (sometimes at the expense of memory, if you’re caching large amounts of data). Remember, also, that if DB log is enabled each logging call is a separate database operation, so use the log sparingly – or just log to syslog and use service like Papertrail or Loggly on production sites.

The final results

As the results below show, using XHProf and some thoughtful optimizations I was able to cut total run time significantly in one use case (Case 2) and slightly in another use case (Case 1). Case 1 was already running in a reasonable amount of time, so here I was mostly interested in the Case 2 numbers (assuming I didn’t make anything too much worse).

Bar chart comparing the run time of various runs

Think of the big picture, part 2

Remember that controlled experimental metrics are just a means to understanding and improving real-world performance (which you can also measure directly using tools like blackfire, but that’s another blog post). In my case, at the end of the day we decided that the most important thing was to ensure that there wasn’t a performance impact on the production site while this background import code was running; so one of the optimizations we actually ended up implementing was to force this code to run slower by throttling $entity->save() operations to maximally 1 every 1/2 second or so, as a way to minimize the number of requests MySQL was having to respond to from the importer. XHProf is a powerful tool, but don’t lose the forest for the trees when it comes to optimization.