Installing XHProf to Profile Drupal Module

Headshot of Tim Stallman with building backdrop

Tim Stallman —

an XHProf callgraph

XHProf is a profiling tool for PHP code – it tracks the amount of time and memory your code spends in each function call, allowing you to spot bottlenecks in the code and identify where it’s worth spending resources on optimization. There are have been a number of PHP profilers over the years, and XDebug has a profiler as well, but XHProf is the first one I’ve successfully managed to configure correctly and interpret the output of.

I had run across a number of blog posts about using XHProf + Drupal, but never actually got it to work successfully for a project. Because so much of the documentation online is incomplete or out-of-date, I thought it would be useful to document my process using XHProf to profile a Drupal 8 custom module here. YMMV, but please post your thoughts/experiences in the comments!

How to find documentation

I find the php.net XHProf manual entry super-confusing and circular. Part of the problem is that Facebook’s original documentation for the library has since been removed from the internet and is only accessible via the WayBack Machine.

If there’s only one thing you take away from this blog post, let it be: read and bookmark the WayBack machine view of the original XHProf documentation, which is at http://web.archive.org/web/20110514095512/http://mirror.facebook.net/facebook/xhprof/doc.html.

Install XHProf in a VM

If you’re not running DrupalVM, you’ll need to install XHProf manually via PECL. On DrupalVM, XHProf is already installed and you can skip to the next step.

sudo pecl install xhprof-beta

Note that all these commands are for Ubuntu flavors of linux. If you’re on Red Hat / CentOS you’ll want to use the yum equivalents. I had to first install the php5-dev package to get PECL working properly:

sudo apt-get update
sudo apt-get install php5-dev

And, if you want to view nice callgraph trees like the one below you’ll need to install the graphviz package sudo apt-get install graphviz

installing xhprof profile drupal module

Configure PHP to run XHProf

You need to tell PHP to enable the xhprof extension via your php.ini files. Usually these are in /etc/php5/apache2/php.ini and /etc/php5/cli/php.ini. Add the following lines to the bottom of each file if they’re not there already. You will also need to create the /var/tmp/xhprof directory if it doesn’t already exist.

[xhprof]
extension=xhprof.so
;
; directory used by default implementation of the iXHProfRuns
; interface (namely, the XHProfRuns_Default class) for storing
; XHProf runs.
;
xhprof.output_dir="/var/tmp/xhprof"

Lastly, restart Apache so that the PHP config changes take effect.

Set up a path to view the XHProf GUI

The XHProf GUI runs off a set of HTML files in the xhprof_html directory. If you’ve been following the install steps above, you should be able to find that directory at /usr/share/php/xhprof_html. Now you need to set up your virtual host configuration to serve the files in the xhprof_html directory.

I find the easiest way to do this is just to symlink the xhprof_html directory into the existing webroot of whatever site you’re working on locally, for example:

ln -s /usr/share/php/xhprof_html /var/www/my-website-dir/xhprof

If you’re using DrupalVM, a separate vhost configuration will already be set up for XHProf, and the default URL is http://xhprof.drupalvm.dev although it can be changed in your config.yml file.

Hooking XHProf into your module code

Generally, the process of profiling a chunk of code using XHProf goes as follows:

  1. Call xhprof_enable()
  2. Run the code you want profiled
  3. Once the code has finished running, call xhprof_disable(). That function will return the profiler data, which you can either display to the screen (not recommended), or…
  4. Store the profiler data to a file by creating a new XHProfRuns_Default(); object and calling its save_run method.

In the case below, I’m profiling a module that implements a few Drush commands from the command line which I’d like to optimize. So I created _modulename_xhprof_enable() and _modulename_xhprof_disable() functions – the names don’t matter here – and then added a --profile flag to my Drush command options which, when it is set to true, calls my custom enable/disable functions before and after the Drush command runs.

Here’s what those look like in full:

<?php
/**
 * Helper function to enable xhprof.
 */
function _mymodule_enable_xhprof() {
  if (function_exists('xhprof_enable')) {
    // Tell XHProf to track both CPU time and memory usage
    xhprof_enable(XHPROF_FLAGS_CPU + XHPROF_FLAGS_MEMORY,
      array(
        // Don't treat these functions as separate function callss
        // in the results.
        'ignored_functions' => array('call_user_func',
          'call_user_func_array',
        ),
      ));
  }
}

/**
 * Helper function to disable xhprof and save logs.
 */
function _mymodule_disable_xhprof() {
  if (function_exists('xhprof_enable')) {
    $xhprof_data = xhprof_disable();

    //
    // Saving the XHProf run
    // using the default implementation of iXHProfRuns.
    //
    include_once "/usr/share/php/xhprof_lib/utils/xhprof_lib.php";
    include_once "/usr/share/php/xhprof_lib/utils/xhprof_runs.php";

    $xhprof_runs = new XHProfRuns_Default();

    // Save the run under a namespace "xhprof_foo".
    //
    // **NOTE**:
    // By default save_run() will automatically generate a unique
    // run id for you. [You can override that behavior by passing
    // a run id (optional arg) to the save_run() method instead.]
    // .
    $run_id = $xhprof_runs->save_run($xhprof_data, 'xhprof_mymodule');

    echo "---------------\nAssuming you have set up the http based UI for \nXHProf at some address, you can view run at \nhttp://mywebsiteurl.dev/xhprof/index.php?run=$run_id&source=xhprof_mymodule\n---------------\n";
  }
}

The echo command here works fine for a Drush command, but for other tasks you could log the run url using watchdog.

Note: Another way to run XHProf on a Drupal site is using the XHProf module, but I haven’t had great luck with that.

Viewing profiler results

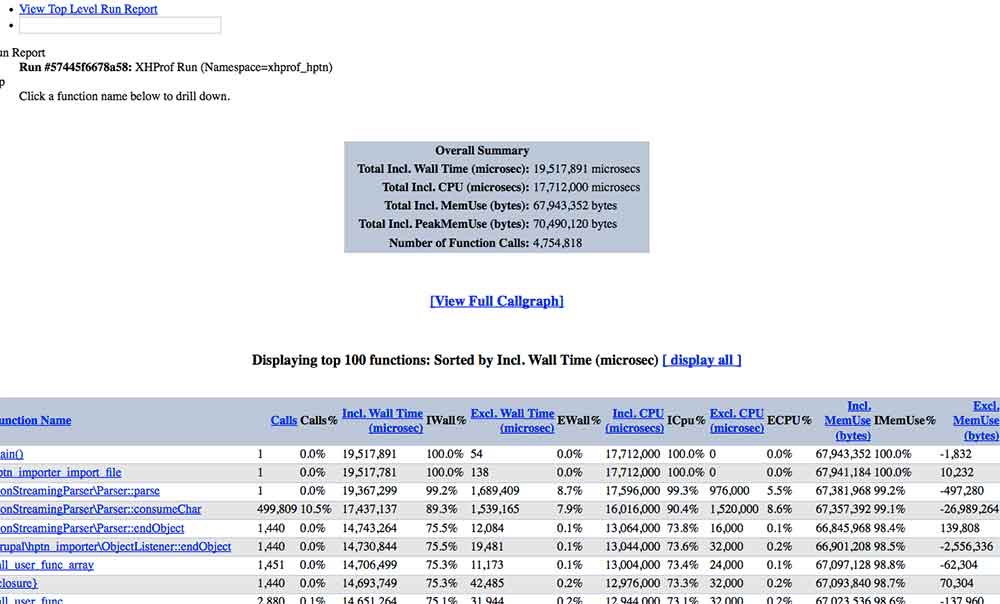
If everything is configured correctly, when you run your module you should get a run ID output either to the screen (via echo, as above, or however you’ve configured this logging). Visit the URL you configured above for xhprof, and you should see a list of all the stored runs. Clicking on a run will bring up the full profiler report.

Sample screenshot of an XHProf profiler report

Now what?

Now you’ve got all this data – how to make sense of it? What to do with it? Stay tuned for more discussion of how to interpret XHProf results and a real-world example of profiling a D8 module, next week!

RELATED READ

Using XHProf to Profile Your Drupal Module